

- Entering Biogas
- Using The Map Tab
- Using The Zoom to State Tool
- Using the Basemap Tool
- Creating Reports
- Proximity Report
- Accessibility Features
Welcome to the BioGas Information System, an advanced tool for evaluating the feasibility and opportunities for BioGas systems. The information systems presents data on BioGas infrasturcture, natural gas fueling stations, pipelines, market demands, substrate, NRCS EQIP Practice Standards, watersheds, boundaries, and soil information. The system also allows users to create reports on the feasiblity of BioGas systems.
Entering BioGas
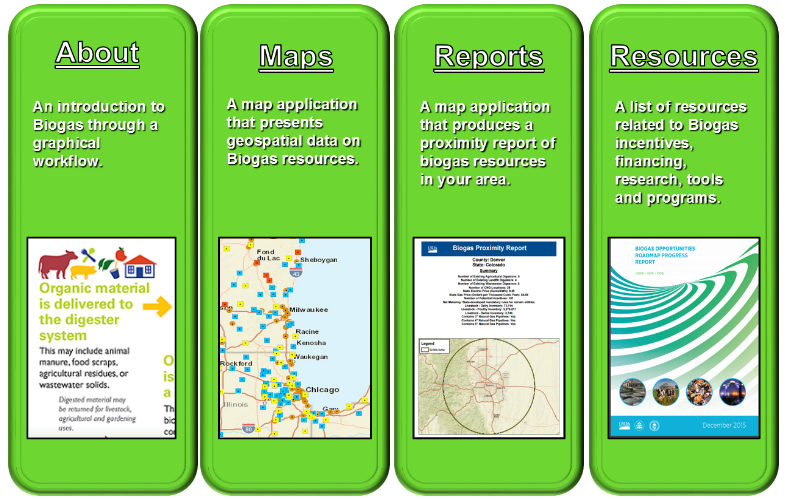
The BioGas interface will display an introductory page and a series of tabs and buttons across the top of the page. The tabs highlight BioGas workflows, an interactive map, an interactive Biogas proximity report and additional Biogas resources.
Next to the tabs there is a single button:
 The Toggle Map Size button will maximize the application to fill the entire browser window.
Using The Map Tab
The map tab displays an interactive mapping application that displays a variety of data related to Biogas. The map application is organized into a Table of Contents, Interactive Map, Layer Information, Basemaps, and Bookmarks. The data displayed in the map application is organized by map group with different map layers.

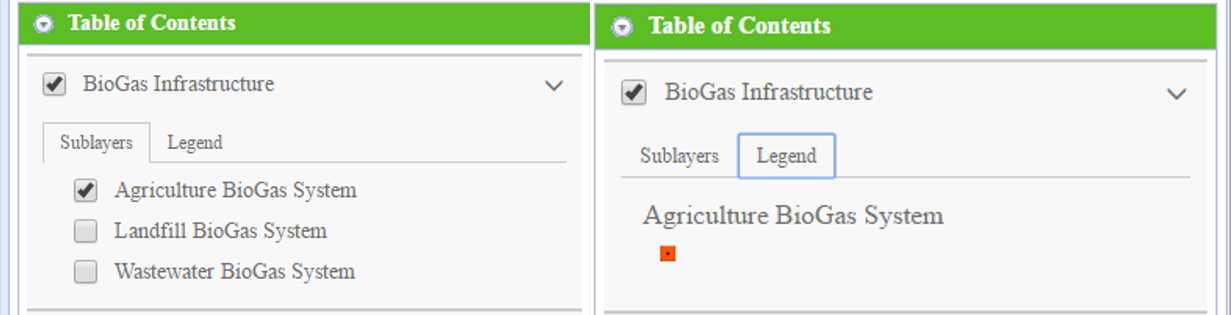
The Table of Contents provides a list of map layers and their legends, and allows you to turn individual map layers on and off. Each map layer in the list has a check box that allows you to easily control its visibility. Each map layer has expansion arrows to indicate that they contain sublayers.
The Interactive Map displays geographic data and can be navigated by zooming in or out and panning the map. The map can be zoomed in by scrolling the mouse wheel up while hovering over the map or clicking the plus button in the upper left corner of the map. The map can also be zoomed in by holding the shift button while holding the left mouse button down and dragging a rectangle over the map. The map can be zoomed out by scrolling the mouse wheel down or clicking the minus button in the upper left corner of the map.
To view the data for any feature in the map, single click on the feature in the map. This will display the information window. The information window displays all of the features occurring at the location clicked. The different features can be displayed by scrolling through them with the arrows in the upper right corner of the information window.

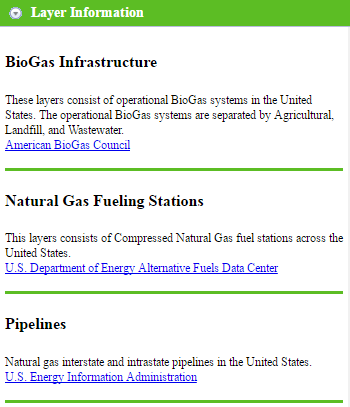
The Layer Information section provides a list of all the map layers and their description within the interactive mapping application. The Layer Information section also provides a reference to the website where the data was obtained.
Using The Zoom to State Tool
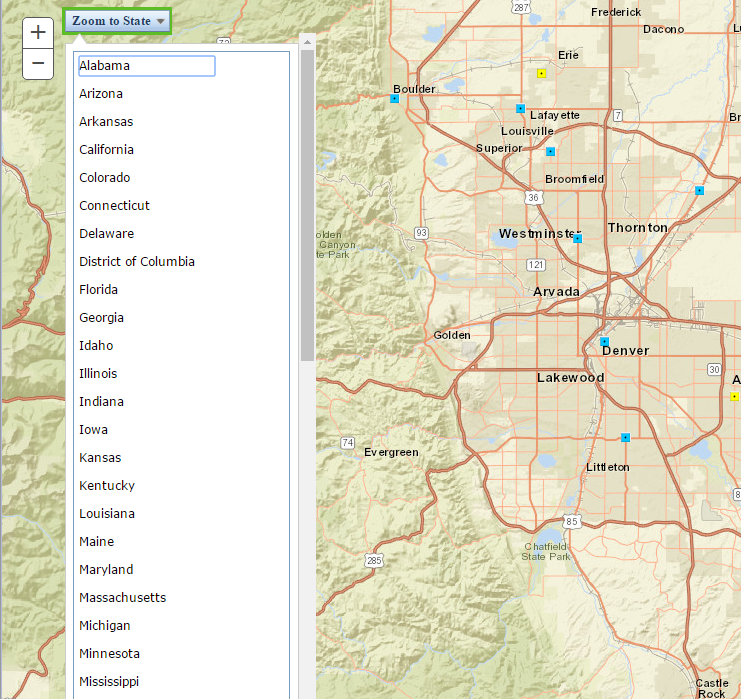
The interactive mapping application uses a tool that allows zooming to each state within the United States. Click the zoom to state tool in the upper left corner of the interactive mapping application to open the interface. Click any of the states to zoom to that state.
Using the Basemap Tool
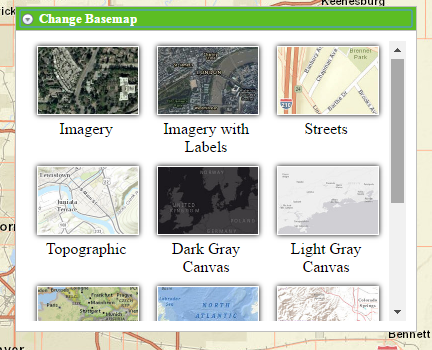
The interactive mapping application also contains a basemap tool. This tool allows a user to change the basemap of the interactive mapping application. Click on the change basemap tool in the upper right corner of the interactive mapping application to open the interface. Click on any of the basemaps to change the basemap of the interactive mapping application. The basemap tool contains the following basemaps: Imagery, Imagery with Labels, Streets, Topographic, Dark Grey Canvas, Light Grey Canvas, National Geographic, Oceans, Terrain with Labels, Open Street Maps, USA Topo Maps, and USGS National Map.
Creating Reports
The BioGas application provides the ability to create a custom report that compare and summarize information across counties and geographic regions
Proximity Report
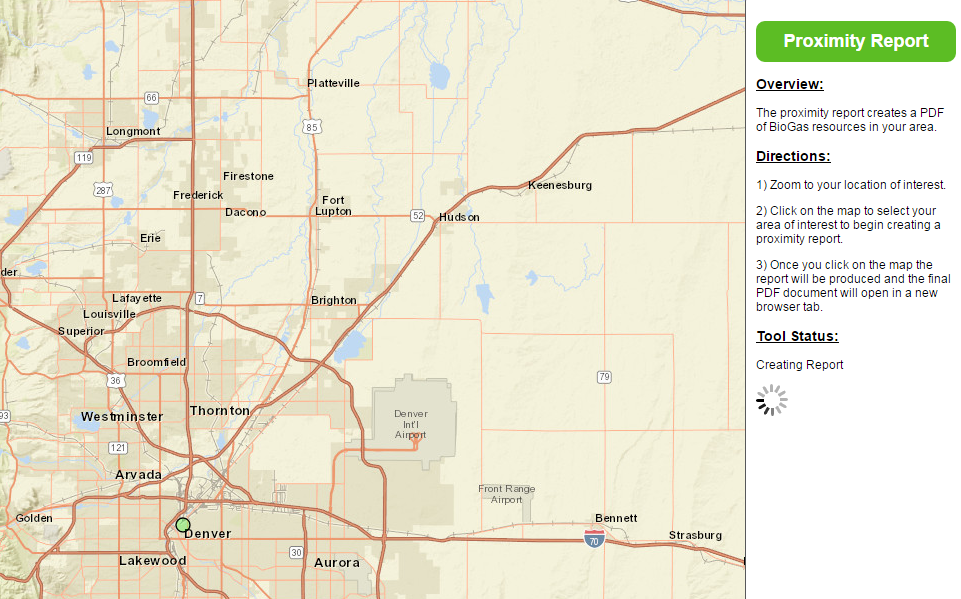
The Proximity Report Tool is located in the Reports Tab. It summarizes information in the map within a 50 mile radius of any point clicked in the map. To use the proximity report tool navigate to the Reports Tab. Once you are within the Reports Tab, a user can click a location on the map. A green circle will appear on the map that represents an area where a 50 mile radius will be created. Once the report is created, it will display in a new browser window.
Accessibility Features
The easiest way to navigate the site is using the tab key. The tab key will move the focus to each major section, link, or button in the application. The spacebar will open links and the enter key can be used to click buttons. The application consists of a tool bar and a tabbed interface. Press tab to select the first tool on the toolbar. Press tab to go through the tools and get to the first tab: Introduction. Press tab again to enter the contents of the tab. Press shift tab to return to the list of tabs. Navigate the tabs with the down arrow and up arrow. When entering the contents of a tab, screen reader software will announce what type of contents are within the tab. Most browsers and screen reader software will then automatically read the contents of the tab. If the contents are not automatically read in your browser please use your screen reader's command buttons, such as: element short cut keys for paragraphs, graphics, and tables or the "Say All" command. The map and report tab of the application contains an interactive map application. Data displayed in this map can be downloaded in tabular form by following the Download Data link under the Related Topics Section. Use the tab key to navigate to the related topics section.